

US households are wealthier than ever, with much of their wealth tied to corporate equities. How does wealth concentration in stock markets—stock markets that are themselves concentrated in bigger companies and at the whim of passive index funds—affect households' wealth and retirement risks?
The risks are huge: households can lose their net worths (think: savings) due to volatility, and given that more retail traders and hedge funds use leverage to further grow their returns, volatility means risks materialize faster and hit households harder than they would otherwise.
In the charts below, we show how household wealth has transformed over the past decade, and how stock markets are more precariously leveraged today than ever before.
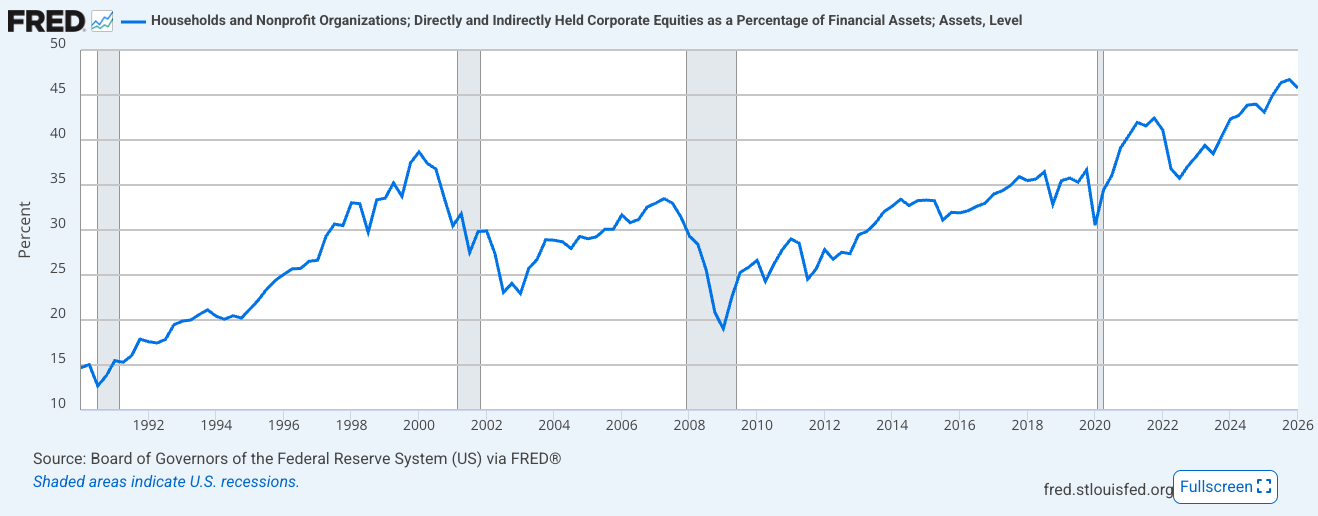
US households are wealthier than ever, with over $174 trillion in net worth in 2026[1]. More importantly, for the first time in history, the proportion of their assets in corporate equities is above 45% and nearing 50%[2].
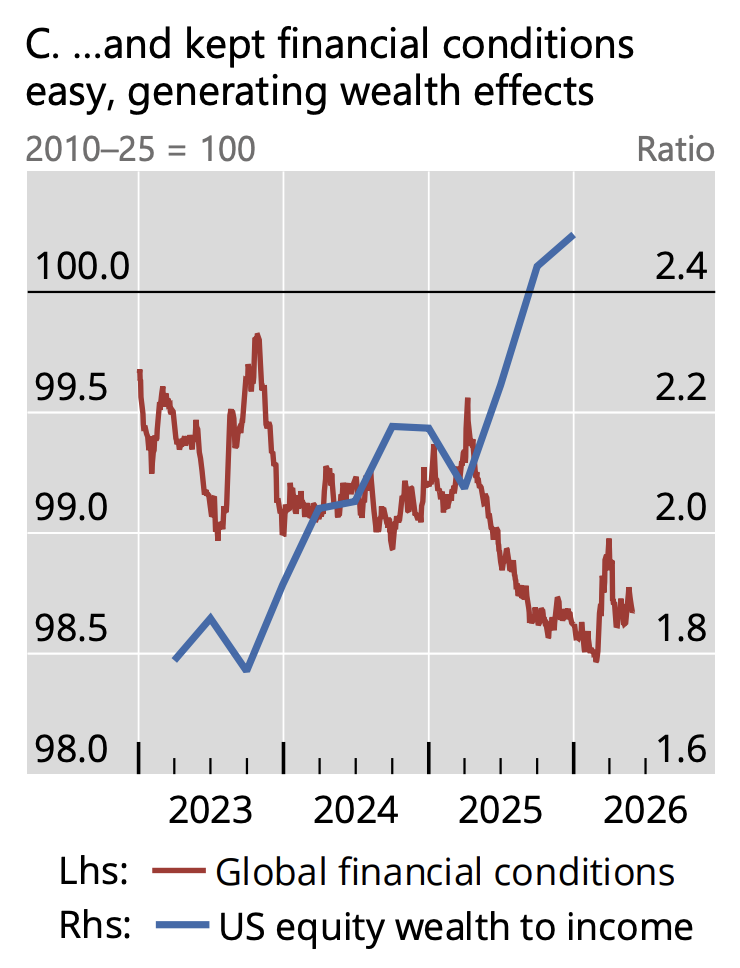
US equity wealth to income has grown by about 33% since 2023.[3] The proportion of US equity wealth to income is higher than at any point in the past few years.
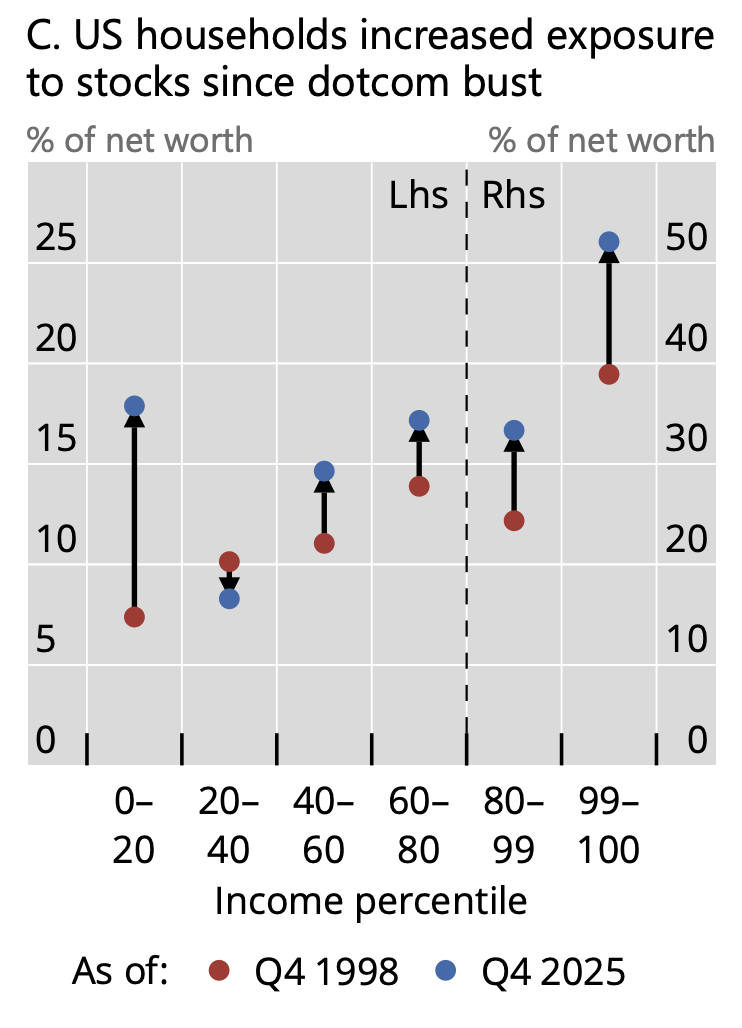
Nearly every income percentile in the US has increased its exposure to US equities as a percentage of its net worth, compared to the US dot-com bubble (i.e., 25 years ago).[3]
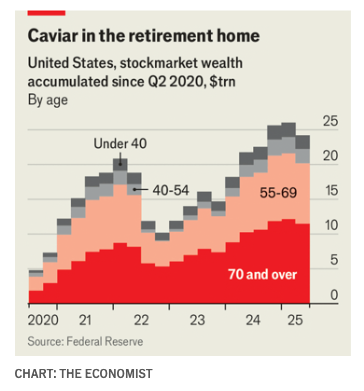
This is true by age, too. The chart below shows stock market wealth accumulated since 2020 is nearing $25 trillion. All age cohorts are growing, though older generations have amassed significantly more wealth, probably due to higher incomes and more pre-existing stock ownership.[4]
While the numbers are smaller for younger people, the share of 25-year-olds moving money into retail investment accounts rose 6× over the past decade. This is leading to more aggressive investing from retail traders, too. Retail investors account for about 18% of stock turnover and are also responsible for the bulk of growth in options trading.[5] They are a key reason why short-dated options volume has grown 318% since 2018.
The charts above tell a story about household assets: US households are wealthier, holding more of their wealth in equities, and are comfortable investing in riskier assets—like options. These trends are consistent across nearly all income and age levels. Everyone is growing their wealth via US equities.
Let's take a look at what happens when people actually put their money into the markets. Where does it go?
Money is being invested in passive funds and index trackers, with 2026 hitting new milestones. The Vanguard S&P 500 ETF had $110 billion in inflows[6]. US-listed ETFs had $1 trillion in inflows in the first half of 2026, compared to $1.5 trillion in all of 2025 and $1.1 trillion in 2024. That's $3.6 trillion in new money chasing US stocks via ETFs alone, just in the past 2.5 years! As a case in point: Vanguard Group's S&P 500-tracking ETF surpassed $1 trillion in assets this year[7], and this is just one passive ETF.
Passive investing isn't the only thing driving prices up. Borrowing money for investments is more prevalent across retail traders and hedge funds.
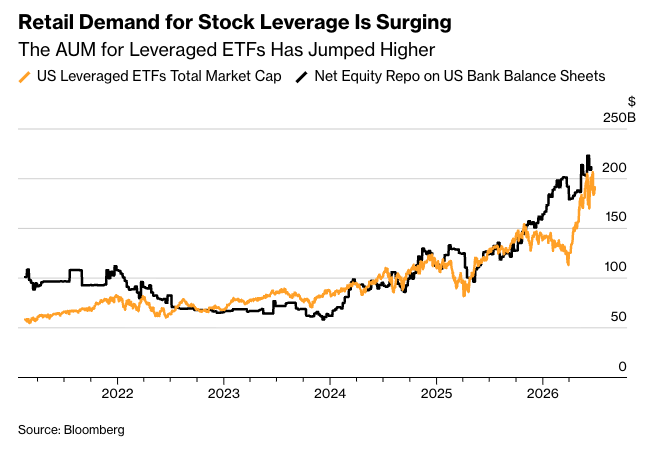
Aggressive, leveraged ETFs are having a moment, with about $200 billion in AUM in leveraged ETFs[8]. These ETFs move 2, 3, or more times the underlying asset, or potentially short it, creating more volatility when stock prices move up or down.
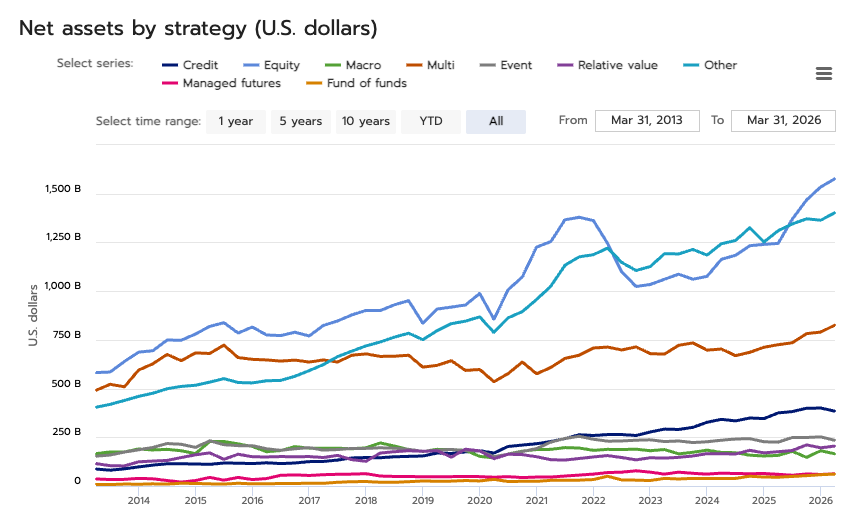
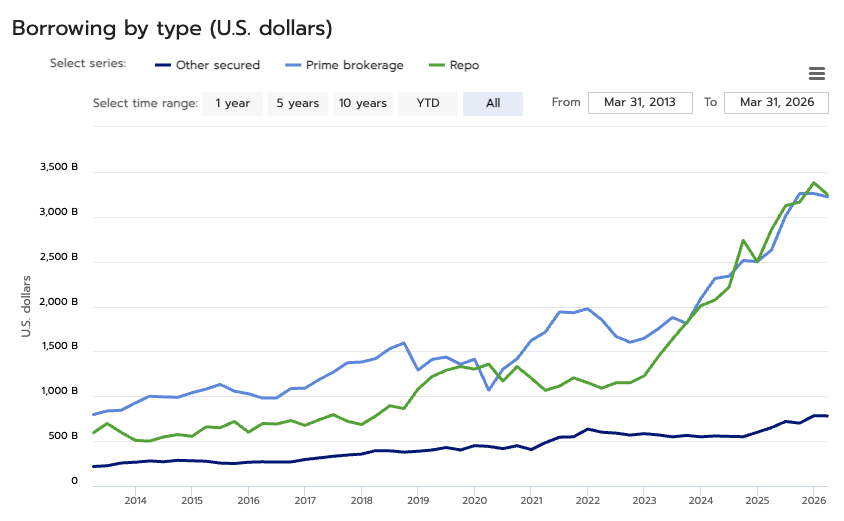
Hedge funds are more invested in US equities than ever before[9], and their borrowing is higher than at any other point in time too.[10]
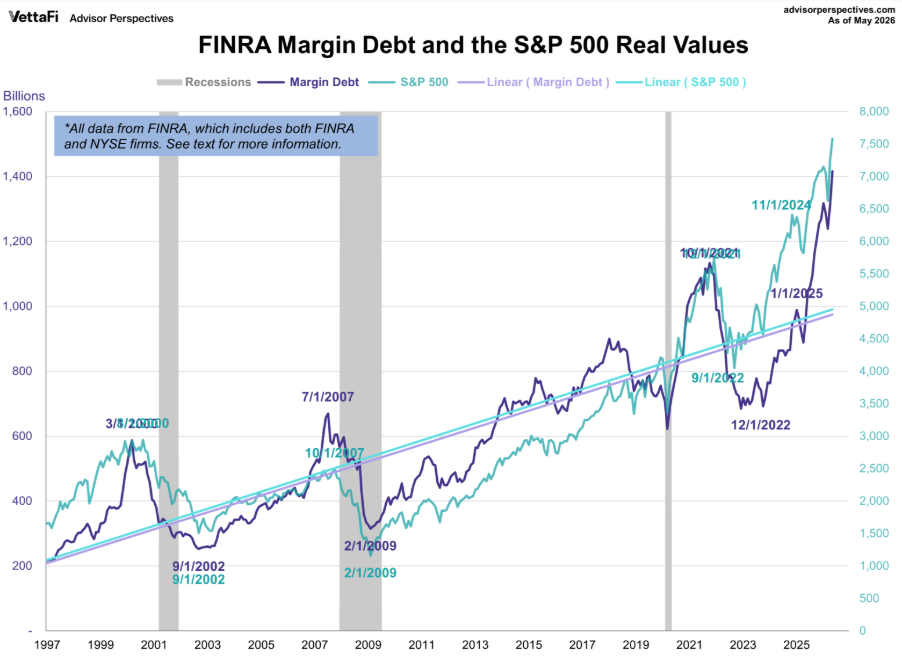
Aggregate margin debt is higher than ever at $1.53 trillion[11]. It grew 7.9% in June, after growing 8.5% month-over-month in May. More concerning is the trendline, showing steady margin debt growth.
Foreign inflows into US equities are spiking, tracking to about $900 billion in net inflows over the past 12 months[12]. Foreign inflows drive up share prices, might use leverage, and generally reinforce the patterns we discussed above.
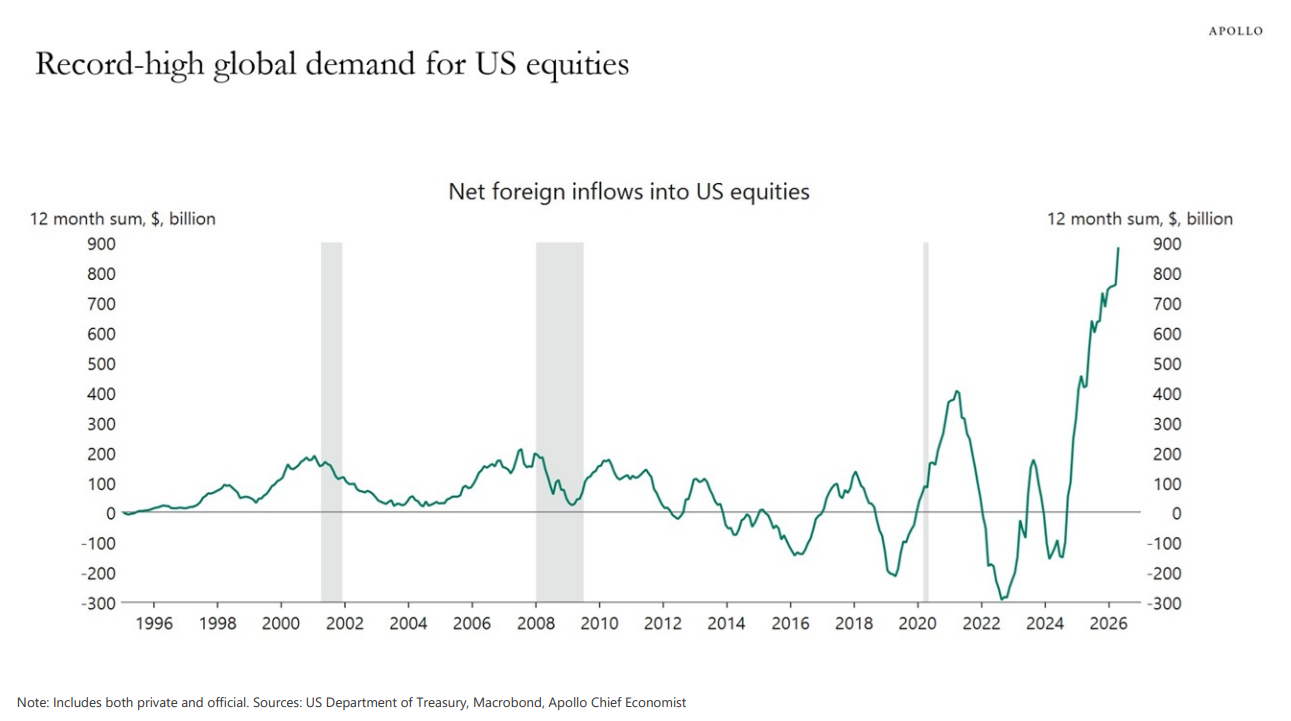
Net inflows are more volatile since 2020. This can also present major risks. The NASDAQ declined about 28% between mid-2021 and the end of 2022, in line with net inflows dropping from their peak to their trough around 2022.
Financial inflows can drive asset prices up regardless of their underlying fundamental values. If there is a small amount of stock available for purchase and households are investing their savings—or borrowing to double down—then this will drive asset prices up. This leads to a feedback loop: future savers, investors, and speculators will treat that asset price appreciation as a reason to invest more.[13]
The point of this post is not to speculate on asset prices, but rather to discuss the underlying risk that equities might hold for US households. We're seeing US household wealth holding more US equities than ever before, and everyone is doing it—retirees, young people, and international investors are putting more into US equities. With passive investing and leverage, the pricing power of the dollars they put into the markets is compounded.
This sort of compounding can lead to significant volatility: every dollar out of the market also compounds its effects, leading to increased losses on the way down. In other words, we can expect to see significantly more volatility in markets as these trends continue. The positive feedback loop US households are benefiting from becomes a negative one, taking all investors down with it.
Day-to-day volatility can be managed, however, and our own concern is around what happens when people retire and start selling their assets to fund their retirement. Any sort of US equity outflows will cause retirement savings to drop if those savings are so heavily invested in US equities. This can be driven by the need for money in retirement, or extrinsic events—geopolitical developments, a market crash elsewhere, or something completely unexpected.
If you're heavily invested in stocks and are planning to retire—or can't afford to lose your savings—it might be worth considering the charts above as you plan your next steps.[14]
Join hundreds of AI, geopolitics, and economics experts. We'll send 1–2 emails per week, and we will never share your e-mail with anyone.



.svg)
