

If you look at current options prices and indices derived from them, they seem to be saying something similar: everything is fine, everybody is happy, and don't worry—for at least the next 30 days.
The Chicago Board Options Exchange (CBOE) manages options trading and runs indices to help understand how options markets are behaving. Option prices are great financial instruments for understanding where investors are expecting prices to go. Given that options are priced to track various price levels of stocks (i.e., their strike prices), have expiries (i.e., time frames), and Greeks (i.e., metrics to track price in relation to time frames, volatility, and interest rates), one can use them to get a rigorous perspective on market perceptions of risk and the price the market is willing to pay to avoid or accept that risk.
Interestingly, the major indices tracking S&P 500 constituents imply that the next 30 days will be some of the quietest and calmest of the year… It's as if nothing is happening this coming month!
Of course, this is what option prices imply the market expects. More importantly, do we agree with this conclusion? Absolutely not—and when markets expect nothing to happen, and something does, then you can likely expect a pretty aggressive response in terms of selling, buying, and price changes. An unexpected crisis tomorrow can be an opportunity today.
Here, we explore the various indices and what they are telling us.
The Volatility Index (VIX) tracks how much the market
expects share prices to move on an annualized basis, but specifically covers data for the coming 30 days.
It's often described as the “fear gauge” because most investors
buy 30-day options to cover potential losses—i.e., protect themselves from downside
risk, rather than upside rewards.
The VIX can be converted to the market's expectation of the coming
30 days' movements in S&P 500 prices by dividing it by √12.
Friday's close of 14.25 implies the market expects a price move within ±4.1%. More
importantly, as shown in Figure 1, this is one of the lowest values over the past
~12 months.

The VVIX, or the “volatility of the VIX” index, is a measure of
market expectations of the volatility of the VIX itself; the higher the score, the
more options prices imply buyers and sellers expect an “explosive”
event—something where the volatility doesn't just rise, but it does so very
rapidly. Lower scores imply expected changes to be slower in nature. Friday's close of 87.48
put the metric close to this year's lowest level of 85.75.
As an illustration of how wrong the market can be, the VVIX's lowest value
in the past two years was on March 24, 2025—about a week before Liberation Day. The market then corrected itself by hitting the highest VIX and
VVIX for the year shortly after tariff announcements.

Dispersion on S&P 500 options (DSPX) measures how different the
expectations around volatility (up or down!) are between companies. High dispersion can
be interpreted as market participants expecting certain stocks to go up or down while others
remain relatively flat or do the opposite. Low dispersion means that whatever is expected
to happen will likely happen across most companies in one form or another.
Using dispersion and volatility together illustrates the sorts of return expectations options buyers have for S&P 500 constituents. For example, high volatility and low dispersion implies expectations that many stocks will be volatile, while low volatility and high dispersion implies no volatility in most cases, with a few outliers.

Today's low volatility and dropping dispersion, as shown in Figure 3, imply the market expects less volatility and with that trend
applying across the S&P 500. To be clear, DSPX is not at a historical
or 52-week low, but the trendline is interesting. In the last 3 weeks, the index has dropped about
25%, implying the market is feeling like stocks will move with more alignment compared to the past few weeks.
You can see just how high-stakes this past earnings season was, given the DSPX was at 2-year highs around July 21. Market expectations for some stocks were very positive or very negative relative to even past earnings seasons.
The SKEW index focuses on out-of-the-money options, and provides a metric on
how “fat” the return tails are. The larger the skew, the more market participants
expect outsized returns or losses. As you can see in Figure 4, the skew hit its lowest values for the year in early August, and while it has recovered since then, is still relatively low compared to most of the year. Market participants are less concerned about large losses or gains.

SKEW does not take into account the direction of the fat tails—big
positive expectations, big negative ones, or both, can all lead to higher index values. This is
where the CBOE's S&P 500 Left Tail Volatility Index (LTV) comes in. It
specifically tracks the left side of the return distribution—i.e., the losses. The
higher the LTV index, the more participants are paying for (or betting on!) downside
insurance for their S&P 500 holdings.

Figure 5 shows we have less downside risk than most periods in the past year.
Finally, Figure 6 shows how SPOTVOL is also trending
down. This index estimates how volatile option prices are near or at the money mark—i.e.,
where they are already profitable or close to being profitable—in the coming days and
weeks. Like VIX, the lower the value, the less volatile option prices imply the
market will be. Again, we're seeing a lower value than in most other periods in the past
year.

SPOTVOL and LTV are interesting measures to use against the
VIX and VVIX, particularly in the very short run. The creators of these
indices showcase examples[1] where intraday divergences
across these indices can indicate a rapid market unwind or change. Figure 7 shows an example where the divergence of the spot
volatility and left tail volatility indices were leading indicators of broader market moves.
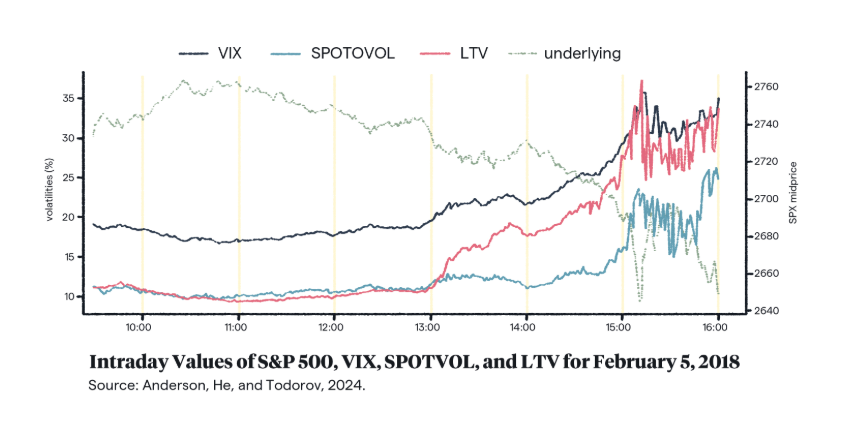
SPOTVOL and LTV acting as leading
indicators of broader market movements. [original]The CBOE indices tell a sleepy story for the end of summer: volatility expectations are low, stocks are more likely to mirror each other's movements, tail risks are low… How wonderful, this life pegged to normally distributed option pricing with less-than-fat tails and skews!
Funnily enough, some journalists argue this occurs because of vacation schedules. Late summer is when European, American, and Asian asset managers take vacations, leaving interns and junior managers to oversee trading, portfolios, and more[2][3][4]. Trading activity can actually go down, and thus the market enters a summer lull.
Of course, just because trading activity is down after the recent high-stakes earnings season doesn't mean we won't actually see volatility. The indices above are all about 30-day expectations, but they do not predict the future.
As tensions between the US and Iran get worse, as the Japanese yen continues to experience volatility, and as other unpredictable developments unfold, we might see something big happen.
All of this leads to two conclusions. First, calmness can lead to opportunities, particularly if you disagree with the market's perspective on the coming weeks. Next, when the market is wrong, it tends to rebalance aggressively—that's when the spikes do come; so be prepared.
Join hundreds of AI, geopolitics, and economics experts. We'll send 1–2 emails per week, and we will never share your e-mail with anyone.



.svg)
